
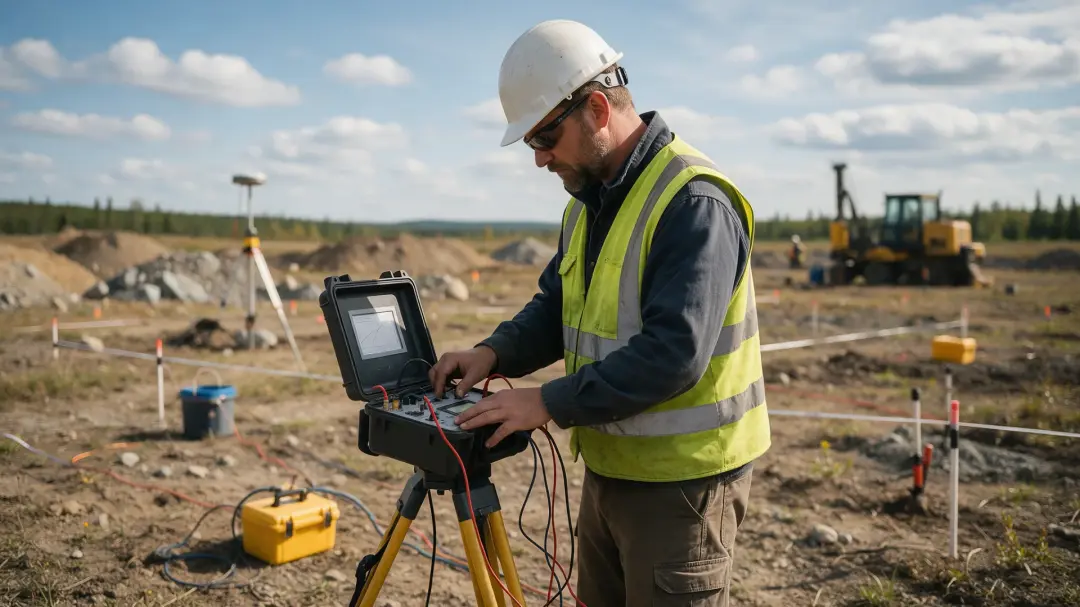
The physics behind electrical resistivity starts with how electric fields drive charge through a material. In geophysics, current and voltage measurements reveal the combined electrical response of soil, rock and pore fluids. Electrode geometry and modelling turn that response into information about the subsurface.
Resistance and Resistivity Are Different Quantities
Resistance describes opposition to current through a particular object or path and is measured in ohms. Resistivity describes a material’s electrical behaviour and is measured in ohm-metres. For a uniform specimen, resistance depends on its length and cross-sectional area as well as resistivity.
The relation is R = ρL/A. A longer sample of identical material has greater resistance, while a wider sample offers more parallel pathways. This explains why two instruments or electrode arrangements cannot be compared using resistance alone: geometry changes the measured value even when the material is unchanged.
Ohm’s Law Connects the Observations
For an ohmic measurement, voltage equals current multiplied by resistance: V = IR. A field instrument applies current and records the resulting potential difference. Their ratio provides a resistance measurement for the electrode arrangement and ground being investigated.
At the material scale, the electric field E and current density J are related by E = ρJ for an isotropic linear conductor. Conductivity σ is the reciprocal of resistivity. These ideal relationships give the starting point for survey interpretation, while real ground adds spatial variation and sometimes direction-dependent behaviour.
How Charge Moves Through the Ground
Metals conduct through mobile electrons. Many geological materials instead conduct mainly through ions in water-filled pores. Clay surfaces and some conductive minerals can add other pathways. A measured contrast can consequently arise from fluid chemistry, water connectivity or mineral composition.
Air-filled pores usually interrupt conductive paths. The arrangement of pores matters alongside their total volume: disconnected wet pockets behave differently from a connected water network. This is why electrical properties can change substantially without any obvious change in the soil’s appearance at the surface.
Why Surveys Use Four Electrodes
A common arrangement has two electrodes injecting current and two measuring voltage. Separating these roles reduces the influence of current-electrode contact on the potential measurement, although poor contact can still limit data quality. The instrument records the transmitted current rather than assuming it always reaches the planned value.
Array choice determines how the measurement weights different parts of the ground. Wenner, Schlumberger and dipole-dipole configurations have different sensitivities. A twin-probe archaeological arrangement also uses current and potential electrodes, with remote and mobile pairs, but its shallow mapping objective differs from a large tomography profile.
Read related articles:
What Rock Resistivity Reveals About Groundwater
How Moisture and Salinity Affect Soil Resistivity
Apparent Resistivity and the Geometry Factor
Apparent resistivity is calculated as ρa = KΔV/I, where K is the geometry factor for the electrode positions. It is the value an ideal uniform half-space would need to produce the observed voltage for that arrangement.
For illustration, if K is 20 metres, voltage is 0.02 volts and current is 0.01 amperes, apparent resistivity is 40 Ωm. This is an invented arithmetic example, not a result from a customer site. In heterogeneous ground, the value mixes contributions from a volume of material; it cannot be assigned automatically to one layer directly beneath the electrodes.
Electrode Spacing Trades Detail for Reach
Increasing array size generally makes the measurement sensitive to a larger and deeper volume, while reducing the ability to isolate small features. Depth is not equal to spacing and depends on array geometry and the electrical structure of the ground.

The EPA’s current technical overview gives idealised investigation depths of approximately 30%, 25% and 20% of current-electrode separation for Wenner, dipole-dipole and Schlumberger arrays respectively. These are uniform-ground approximations, not guaranteed depths for a real site. Source: US EPA electrical resistivity guidance, checked October 2026.
Inversion Builds a Model Rather Than a Photograph
A tomography survey collects many arrangements. Inversion adjusts a numerical ground model until its predicted measurements agree acceptably with the observations. Constraints prevent the calculation from fitting every small error with unrealistic changes in the subsurface.
An inversion can still have several plausible solutions. A sharp boundary may appear smoothed, and a conductive feature outside a line may influence a two-dimensional model. Interpretations should examine sensitivity, residuals and geological plausibility. The colour scale displays modelled electrical properties; it does not independently confirm the identity of a buried object.
Quality Checks Follow the Measurement Physics
Changing the current direction can help identify unwanted background potentials. Repeated measurements test whether a response is stable, while appropriate reciprocal measurements can compare configurations that should agree under the survey’s physical assumptions. Large discrepancies suggest the need to investigate contact, noise, equipment or changing ground conditions.
Quality checks should be planned rather than applied only after an unexpected result. Record rejected measurements and the reasons for excluding them, since selective removal can change the final interpretation. A low model misfit is not proof of good field data: an inversion may fit biased observations or compensate for them with an unrealistic structure. A credible assessment considers instrument checks, the measurement distribution and geological consistency together. This connects the mathematics with field practice and helps explain why a reliable survey requires more than collecting voltage values and asking software to produce a section.
Physics Continues to Shape Better Measurements
A 2025 experimental paper measured electrical conductivity spectroscopy on 40 sandy and clayey soil samples across 10–295 MHz to study moisture and salinity prediction. This high-frequency laboratory research should not be confused with routine low-frequency ground-resistivity surveying. Source: Soil Salinity Frequency-Dependent Prediction Model, 2025 preprint.
The distinction reinforces a practical point: frequency, sensor configuration and the physical model must match the question. Pre-Construct Geophysics describes shallow resistance surveying for archaeological contrasts. Discuss target size, suspected materials and required depth so the proposed measurements address the site’s actual investigation needs.
Summary
Electrical resistivity links current flow to material properties, but field measurements also depend on electrode geometry and the volume sampled. Understanding resistance, apparent resistivity and inversion helps explain both the value of survey maps and the uncertainty attached to their interpretation.
Learn about the shallow archaeological resistivity technique offered by Pre-Construct Geophysics and discuss an investigation suited to your site.
Resistivity Surveys