
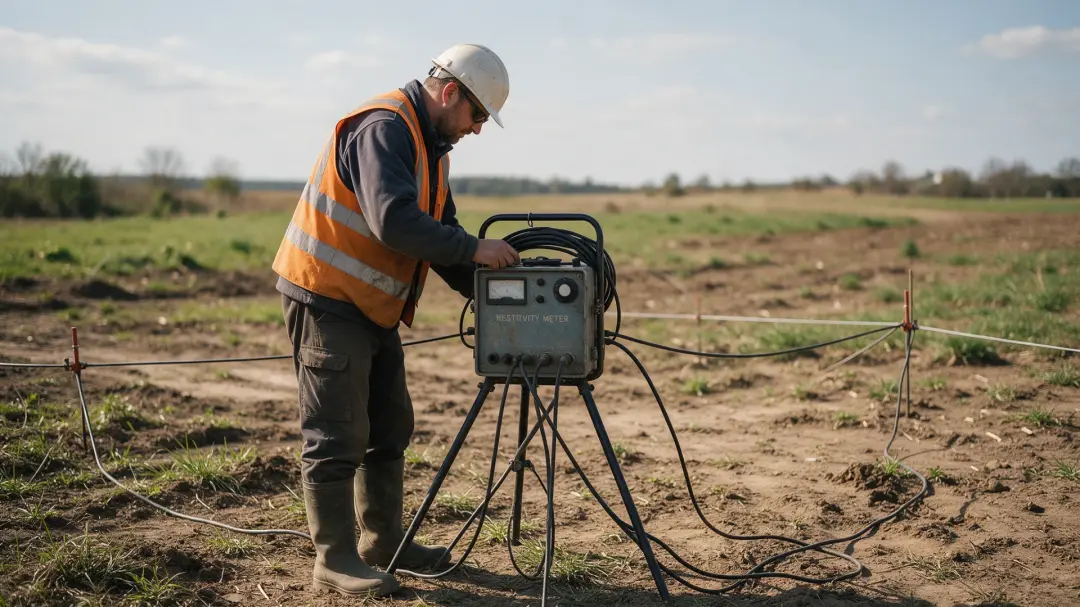
Moisture and salinity affect soil resistivity by changing the continuity and conductivity of pore-water pathways. Wetter soil often has lower resistivity, and dissolved salts can lower it further. The difficulty is distinguishing those effects from changes in texture, temperature and soil structure.
Water Connects Conductive Pathways
Current in many soils travels mainly through water-filled pores. As soil wets, isolated films and pockets can become connected, allowing charge to cross a greater part of the sample. Resistivity commonly decreases, but the relationship is often nonlinear and varies between soils.
A small increase in water content near a connectivity threshold may produce a large electrical change. Once a soil is already wet, another increase need not have the same effect. Converting a reading into moisture content therefore requires calibration rather than assuming that doubling the water always halves resistivity.
Dissolved Ions Make the Water More Conductive
Salinity introduces ions that carry charge through pore water. If texture, temperature and saturation remain comparable, more conductive pore water generally produces lower bulk resistivity. Sources may include saline groundwater, fertiliser, irrigation water or deposited salts, depending on the setting.
Dry salt crystals do not create the same continuous pathway as salts dissolved in connected water. A saline soil can still be resistive when it is extremely dry. The electrical response reflects water and dissolved material together, so a reading alone does not reveal how much salt is present in a particular volume of soil.
Why Rainfall Can Change the Map
Rain increases water content but can also dilute salts or move them deeper. These processes may act in opposite electrical directions: wetting improves conduction while dilution reduces pore-fluid conductivity. The net result depends on drainage, salt distribution and the amount of infiltration.

A repeat survey after rain must therefore be interpreted as a new soil state. Record antecedent weather and the interval since wetting, not just conditions at the moment of measurement. Runoff, ponding and preferential flow can make neighbouring parts of a field respond differently even under the same rainfall.
What a 2026 Flooding Experiment Found
A study published in January 2026 flooded two isolated 2,000 m² coastal-forest plots with 265 m³ of freshwater or estuarine water. Real electrical conductivity increased by about 100% in the freshwater plot and 570% in the saltwater plot. Researchers combined resistivity and induced polarisation with laboratory models. Source: Adebayo and colleagues, Vadose Zone Journal, 2026.
These are responses from a particular experiment, not expected percentage changes for every field. They demonstrate how added salt can amplify a flooding signal, and why separating moisture from salinity needs more information than a single resistivity measurement.
Read related articles:
What Rock Resistivity Reveals About Groundwater
The Physics Behind Electrical Resistivity
Clay, Texture and Compaction Change the Relationship
Clay minerals can support conduction along their surfaces and retain water differently from coarse sand. Fine and coarse soils therefore need different calibration even if their water contents appear similar. Organic material, aggregation and pore shape introduce further variation.
Compaction changes pore volume and connectivity. A compacted zone may contain less air, altered drainage or a different contact network between particles. Its electrical pattern cannot be translated directly into a mechanical strength value. Texture observations and suitable geotechnical measurements help determine which property caused a contrast.
Temperature Needs to Be Recorded
Ion mobility generally increases as water warms, influencing conductivity even without a change in salt quantity. Temperature correction is important when comparing laboratory samples or repeat field surveys. At low temperatures, freezing can interrupt liquid-water pathways and produce substantial increases in resistivity.
A long monitoring series should use a consistent temperature reference or explain why correction is unnecessary for its purpose. Readings collected in different seasons are otherwise vulnerable to mixed explanations. This is especially relevant when a small apparent trend is being used to assess drainage or an environmental change.
Bulk Soil Measurements Differ from Soil Extract Tests
A field resistivity measurement includes the soil’s structure, water distribution and mineral contribution. Laboratory salinity tests often measure an extract prepared with a specified soil-to-water ratio or saturation procedure. These measure related properties but are not numerically interchangeable.
Report the extraction method, units and temperature when using laboratory conductivity to calibrate a field model. A January 2026 SOIL paper specifically addressed separating moisture and salinity contributions to conductivity using an in-situ methodology, illustrating that the separation remains an active measurement problem. Source: Autovino and colleagues, 2026.
A Percentage Change in Conductivity Is Not the Same Change in Resistivity
Because resistivity is the reciprocal of conductivity, percentage changes are asymmetric. In a hypothetical material whose conductivity doubles, resistivity halves. That is a 100% conductivity increase but a 50% resistivity decrease. Confusing the two gives a misleading description of the same electrical change.
When monitoring soil, keep a consistent quantity throughout the comparison and state the baseline. Also distinguish a relative percentage change from an absolute change in units such as siemens per metre. A small starting conductivity can produce a large percentage increase while remaining modest in absolute terms. These reporting details matter when a client compares wetting, drainage or salt movement between areas. Use observations and calibration to interpret the change; do not assume that a conductivity percentage can be copied directly into a percentage increase in water content or salt concentration. Neither relationship is generally that simple.
Implications for Archaeological Resistance Surveys
Moist ditch fills and drier masonry can contrast electrically with surrounding ground. Extreme dryness or widespread saturation may reduce that contrast or make electrode contact difficult. Conditions suitable for one archaeological target are not necessarily optimal for another.
For the shallow survey described by Pre-Construct Geophysics, discuss soil conditions and the suspected features before arranging fieldwork. Avoid treating a low-resistance patch as proof of either a ditch or salinity. The shape of the anomaly, geological background, weather and supporting evidence determine which explanation is credible.
Summary
Moisture controls the connection between pore-water pathways, while salinity changes the water’s ability to carry current. Texture, temperature and structure complicate both effects. Recording conditions and using appropriate calibration makes resistivity patterns more informative than a simple wet-versus-dry interpretation.
Review Pre-Construct Geophysics’s resistance-based survey approach and discuss how your soil conditions may affect the features you want to investigate.
Resistivity Testing